The WorkChapter 01 / 05

Chapter 01 / 2026 / Vision

Football Intelligence

You upload a video of a football match, filmed by the ordinary television camera. The system finds every player and the ball, follows them across the pitch and works out the match statistics. A language model then writes commentary on the tactics, using only those numbers.

What it is

One camera, twenty-two players

One camera. Twenty-two players. Let's see what it can tell us.
You upload a video of a football match, filmed by the ordinary television camera.
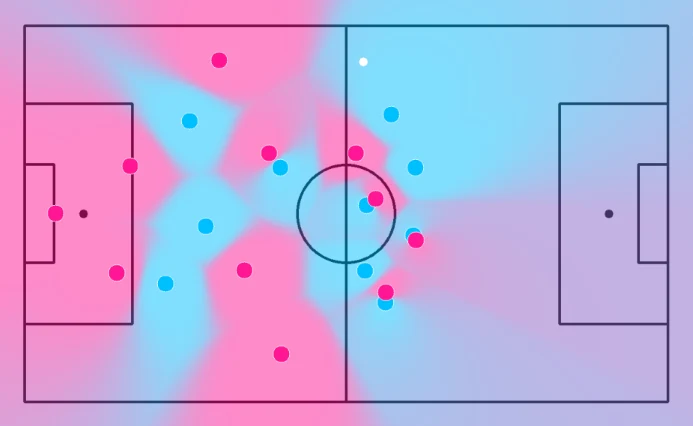
A top-down pitch radar. Pink and blue dots mark the players of two teams, and shaded regions show which team controls each part of the pitch.
The pitch seen from above. Each dot is a player the system found, and the shading shows which team controls each area.
Who it is forClubs and analysts without a stadium full of tracking cameras.

How it works

Track, classify, then explain

First follow every player, then name what happens, then explain it.
1. Find everyoneThe broadcast camera beside the pitch: the one wide view in which the detector finds every player.
2. Follow themEach player keeps one label from frame to frame; the drawing shows the trail every player leaves.
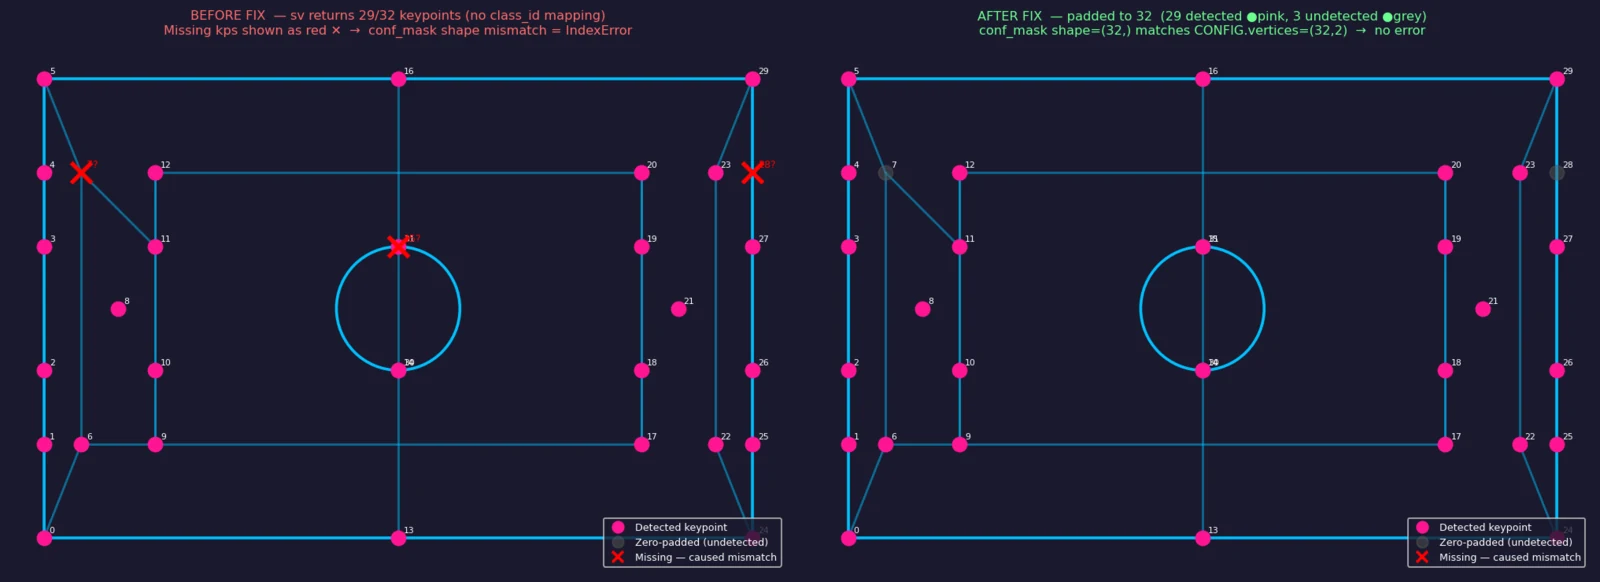
3. Put them on a mapThe fixed points on the pitch lines that turn a spot on screen into metres. Here three were missing, marked in red.
A top-down pitch radar. Pink and blue dots mark the players of two teams, and shaded regions show which team controls each part of the pitch.
4. Count and name what happensWorked out from the positions on the map: which team controls each part of the pitch, by shading.
5. Write it up, then check itThe model writes the commentary from these statistics, and two other models check each claim against them.

What went wrong

The missing corners

Three missing points, and the pitch stopped lining up.

The pitch finder looks for 32 fixed points on the lines of the pitch.
One version of a library returned only the points it could see, so a list could hold 29 instead of 32.

What it measured

Fewer invented numbers

Now most of the numbers in the commentary are real.
0.916The right label stays on the right player about 92% of the time.
A top-down pitch radar. Pink and blue dots mark the players of two teams, and shaded regions show which team controls each part of the pitch.
24 FPSIt reads 24 frames of video a second, close to the speed the video plays.
0.516 → 0.647Events are labelled correctly more often, rare kinds counting as much as common ones: about a quarter better.
48.7% → 70.2%Of the numbers the written commentary states, seven in ten now match the match data, up from under half.
A top-down pitch radar. Pink and blue dots mark the players of two teams, and shaded regions show which team controls each part of the pitch.
The pitch seen from above. Each dot is a player the system found, and the shading shows which team controls each area.

My part and the stack

My partBuilt the whole project as his final-year dissertation: the video pipeline, the event classifier, the web app, the GPU worker and the tests that check the commentary.
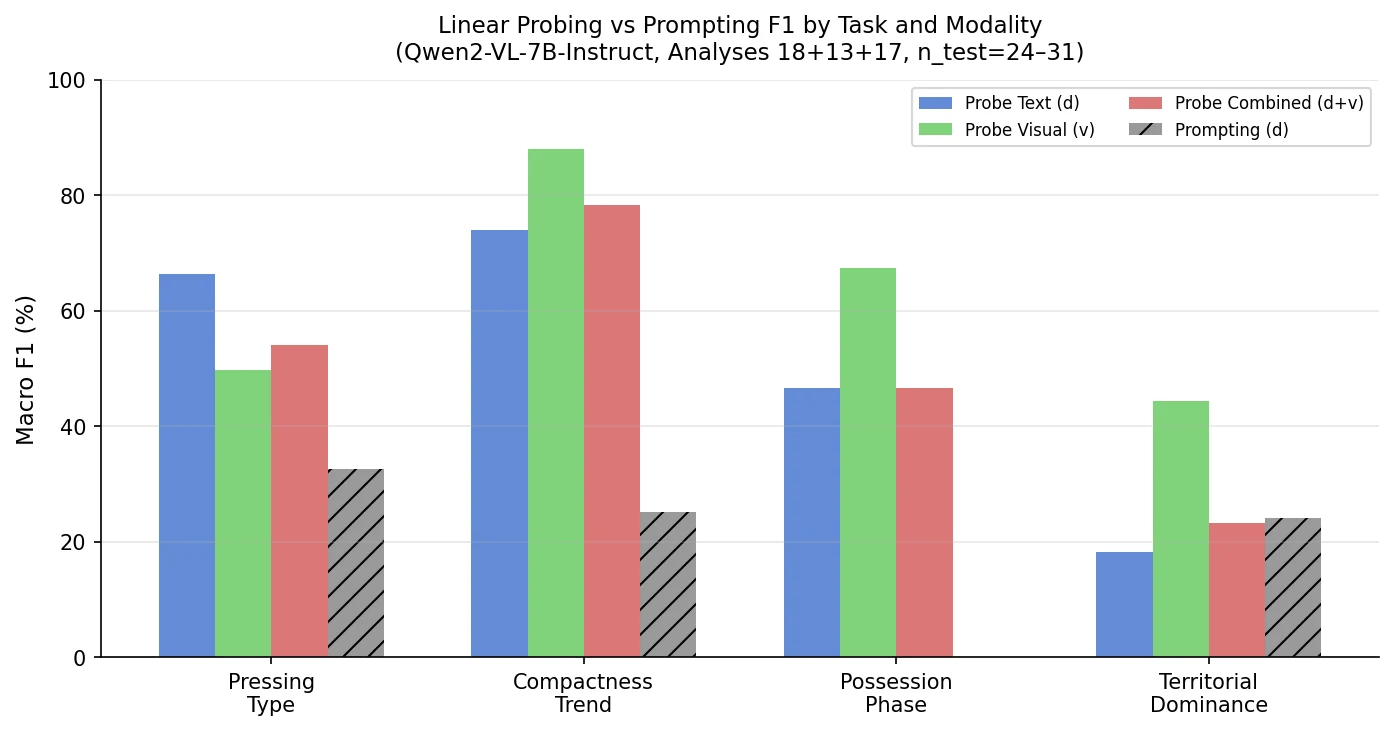
A chart of how well each method reads four tactical patterns. The taller the bar, the more often it is right.